


Investors
Responsibility
Giving Back
Community Impact & Partnership
What began as an idea to support local non-profits more than 60 years ago has evolved into a continuous tradition of giving and community partnership. Today our company is filled with community-minded employees who are proud to carry on our culture of community investment.

Our Marketing Approach
Responsible Marketing
Altria's companies make some of the most iconic brands. Our companies make tobacco products for adults. Society expects us to market them responsibly. We completely agree.
That's why our goal is to build relationships between our brands and their adult consumers while taking steps designed to limit reach to unintended audiences.

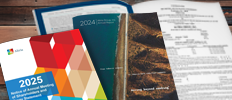
ESG Reporting & Data
Altria's Responsibility Focus Areas were identified through our materiality assessment to be the most impactful Environmental, Social & Governance issues that promote long-term sustainability and success.
Stakeholders also expect us to clearly communicate where we’re focused and how we're doing. We modernized our reporting approach, to better meet the unique information needs of various stakeholders and allow for more continuous dialogue.
Sharing Our Expectations
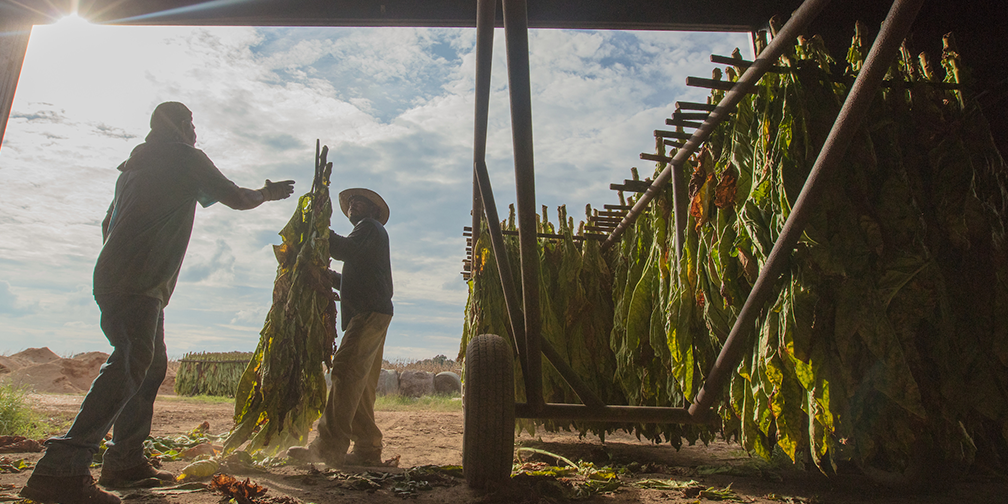
Drive Responsibility through Our Value Chain
Our companies work hard to develop strong, sustainable supply chains by partnering with thousands of suppliers from growers to manufacturers.
Our suppliers deliver high-quality goods and services, manage business risk and find innovative solutions to tough issues. Open dialogue, shared expectations and honest feedback contribute to these strong relationships – some dating back decades.
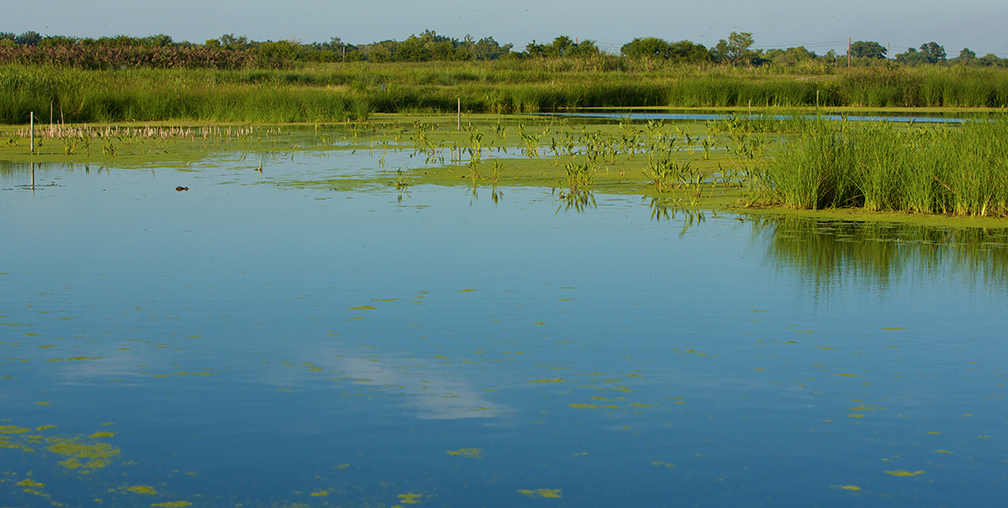
Protecting Our Resources
Protect the Environment
Our companies play an active role in protecting our natural resources and reducing our environmental impact.
We understand the affect our companies and their products may have on our environment, including changes to water quality and availability and climate change, as well as the effect these changes in nature have on our companies.
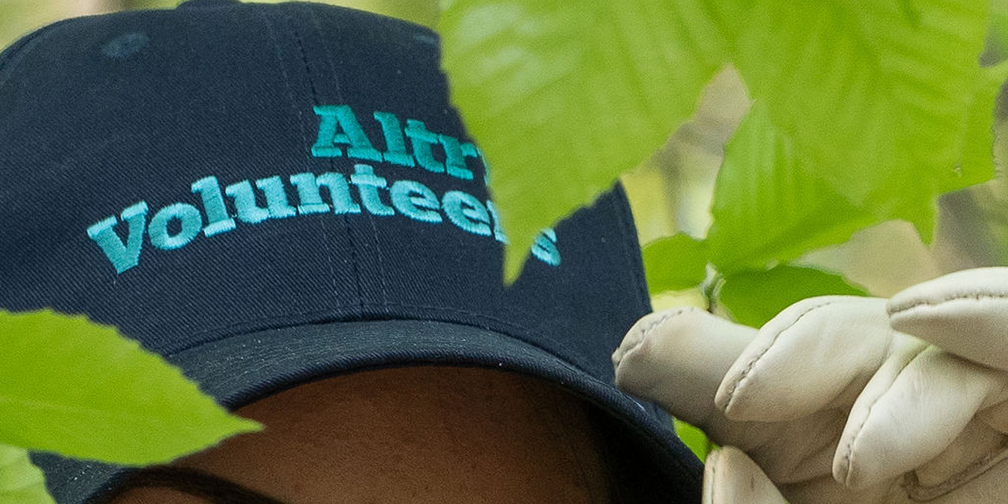
Giving Back
Community Impact & Partnership
What began as an idea to support local non-profits more than 60 years ago has evolved into a continuous tradition of giving and community partnership. Today our company is filled with community-minded employees who are proud to carry on our culture of community investment.
Our Marketing Approach
Responsible Marketing
Altria's companies make some of the most iconic brands. Our companies make tobacco products for adults. Society expects us to market them responsibly. We completely agree.
That's why our goal is to build relationships between our brands and their adult consumers while taking steps designed to limit reach to unintended audiences.
ESG Reporting & Data
Altria's Responsibility Focus Areas were identified through our materiality assessment to be the most impactful Environmental, Social & Governance issues that promote long-term sustainability and success.
Stakeholders also expect us to clearly communicate where we’re focused and how we're doing. We modernized our reporting approach, to better meet the unique information needs of various stakeholders and allow for more continuous dialogue.
Sharing Our Expectations
Drive Responsibility through Our Value Chain
Our companies work hard to develop strong, sustainable supply chains by partnering with thousands of suppliers from growers to manufacturers.
Our suppliers deliver high-quality goods and services, manage business risk and find innovative solutions to tough issues. Open dialogue, shared expectations and honest feedback contribute to these strong relationships – some dating back decades.
Protecting Our Resources
Protect the Environment
Our companies play an active role in protecting our natural resources and reducing our environmental impact.
We understand the affect our companies and their products may have on our environment, including changes to water quality and availability and climate change, as well as the effect these changes in nature have on our companies.
Giving Back
Community Impact & Partnership
What began as an idea to support local non-profits more than 60 years ago has evolved into a continuous tradition of giving and community partnership. Today our company is filled with community-minded employees who are proud to carry on our culture of community investment.
Our Marketing Approach
Responsible Marketing
Altria's companies make some of the most iconic brands. Our companies make tobacco products for adults. Society expects us to market them responsibly. We completely agree.
That's why our goal is to build relationships between our brands and their adult consumers while taking steps designed to limit reach to unintended audiences.
ESG Reporting & Data
Altria's Responsibility Focus Areas were identified through our materiality assessment to be the most impactful Environmental, Social & Governance issues that promote long-term sustainability and success.
Stakeholders also expect us to clearly communicate where we’re focused and how we're doing. We modernized our reporting approach, to better meet the unique information needs of various stakeholders and allow for more continuous dialogue.
Sharing Our Expectations
Drive Responsibility through Our Value Chain
Our companies work hard to develop strong, sustainable supply chains by partnering with thousands of suppliers from growers to manufacturers.
Our suppliers deliver high-quality goods and services, manage business risk and find innovative solutions to tough issues. Open dialogue, shared expectations and honest feedback contribute to these strong relationships – some dating back decades.
Protecting Our Resources
Protect the Environment
Our companies play an active role in protecting our natural resources and reducing our environmental impact.
We understand the affect our companies and their products may have on our environment, including changes to water quality and availability and climate change, as well as the effect these changes in nature have on our companies.
Giving Back
Community Impact & Partnership
What began as an idea to support local non-profits more than 60 years ago has evolved into a continuous tradition of giving and community partnership. Today our company is filled with community-minded employees who are proud to carry on our culture of community investment.
Our Marketing Approach
Responsible Marketing
Altria's companies make some of the most iconic brands. Our companies make tobacco products for adults. Society expects us to market them responsibly. We completely agree.
That's why our goal is to build relationships between our brands and their adult consumers while taking steps designed to limit reach to unintended audiences.
ESG Reporting & Data
Altria's Responsibility Focus Areas were identified through our materiality assessment to be the most impactful Environmental, Social & Governance issues that promote long-term sustainability and success.
Stakeholders also expect us to clearly communicate where we’re focused and how we're doing. We modernized our reporting approach, to better meet the unique information needs of various stakeholders and allow for more continuous dialogue.
Sharing Our Expectations
Drive Responsibility through Our Value Chain
Our companies work hard to develop strong, sustainable supply chains by partnering with thousands of suppliers from growers to manufacturers.
Our suppliers deliver high-quality goods and services, manage business risk and find innovative solutions to tough issues. Open dialogue, shared expectations and honest feedback contribute to these strong relationships – some dating back decades.
Protecting Our Resources
Protect the Environment
Our companies play an active role in protecting our natural resources and reducing our environmental impact.
We understand the affect our companies and their products may have on our environment, including changes to water quality and availability and climate change, as well as the effect these changes in nature have on our companies.
Giving Back
Community Impact & Partnership
What began as an idea to support local non-profits more than 60 years ago has evolved into a continuous tradition of giving and community partnership. Today our company is filled with community-minded employees who are proud to carry on our culture of community investment.
People & Careers


Our Operating Companies